The main window of Proxifier v4 is illustrated below.
The four main parts are , , , and . The first three are panes, so you can adjust their layout, drag-and-drop, dock, hide, close, etc.
To enable/disable the panes, use the . The layout is saved when Proxifier restarts.
You can reset the entire layout using the command.
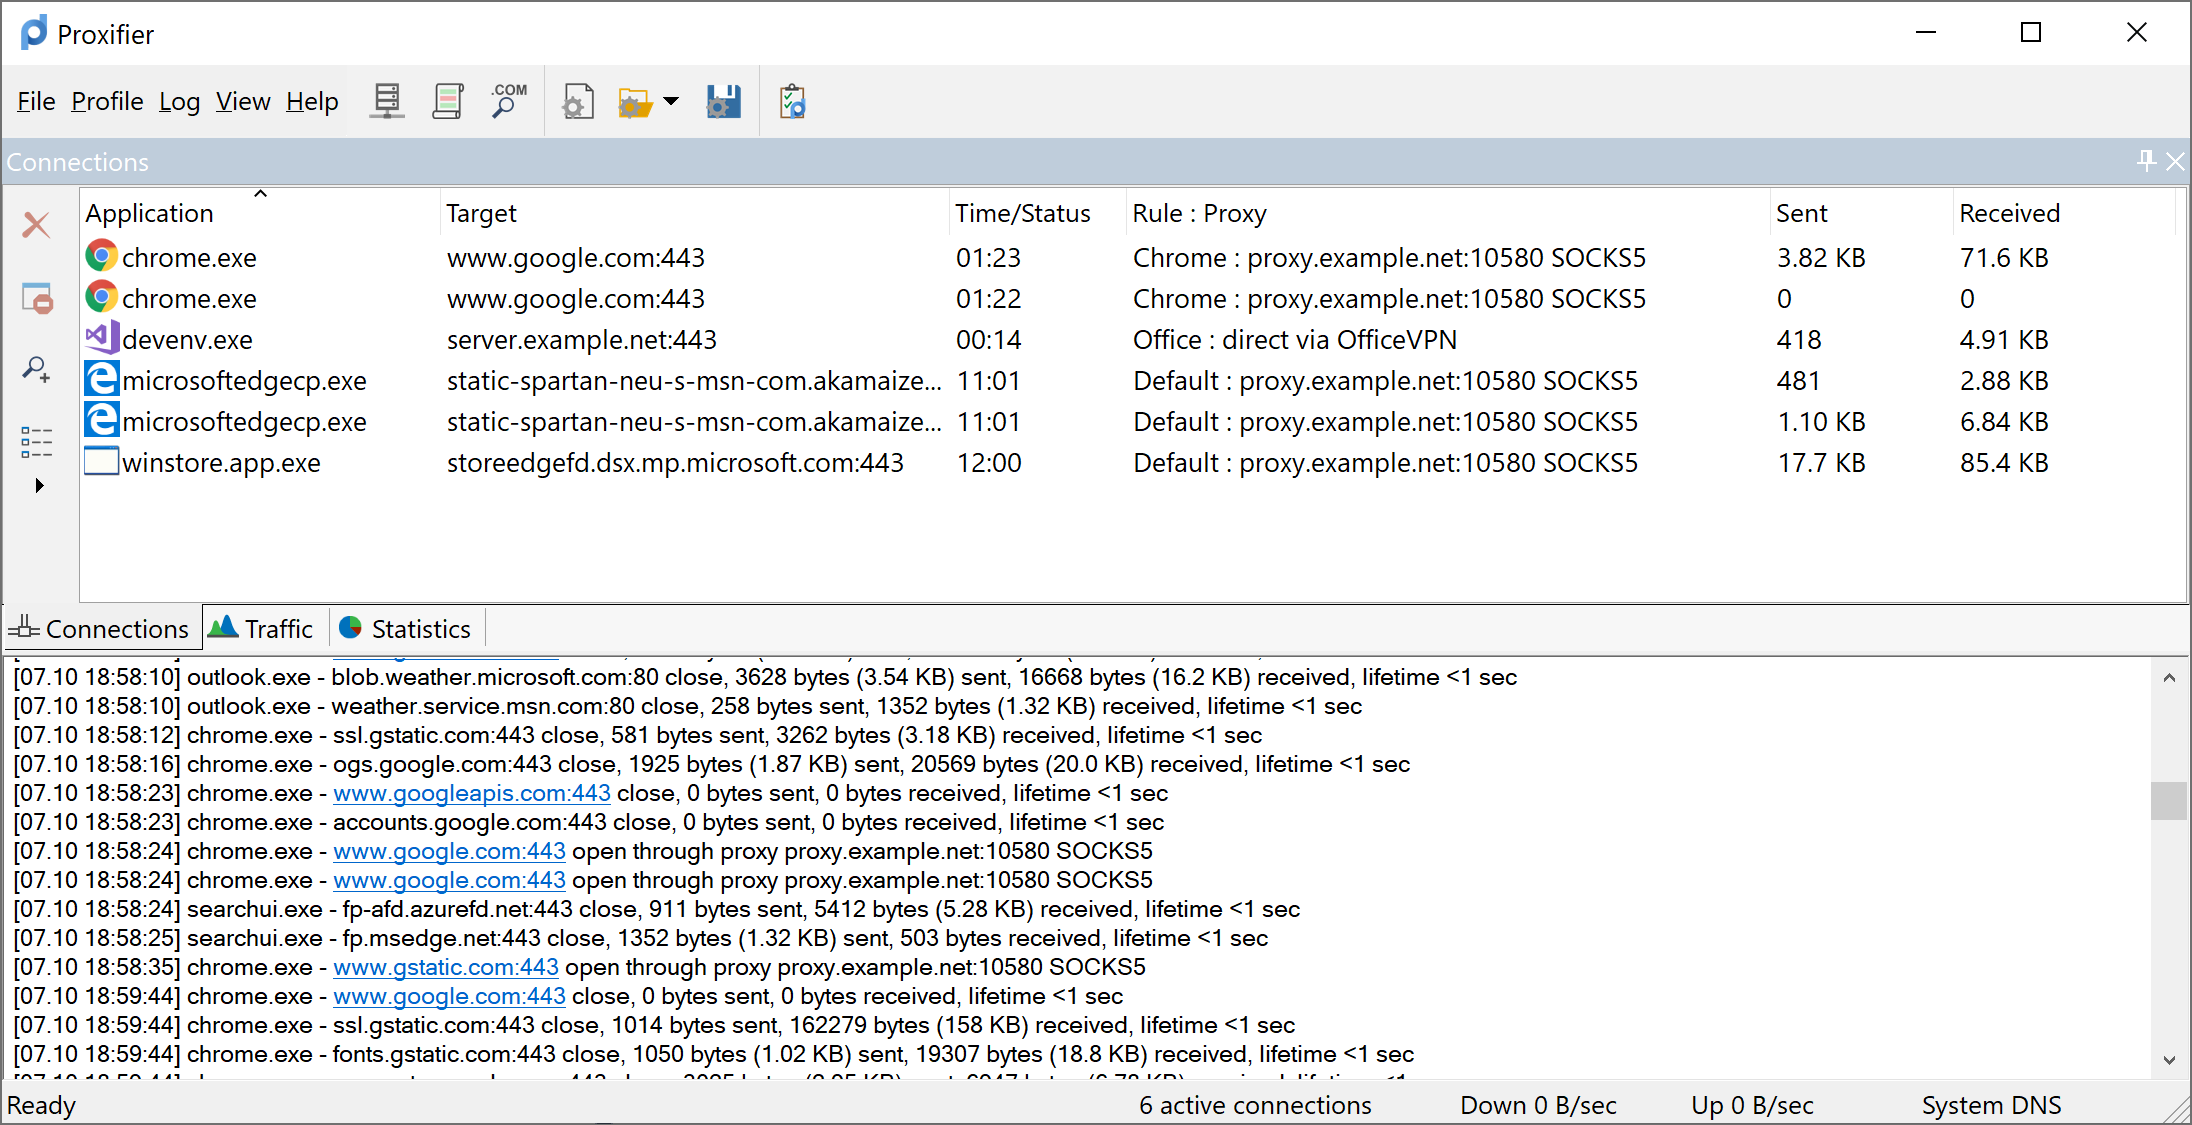
This window provides a list of connections handled by Proxifier. The information about each connection is divided into the following groups (columns):
You can sort the list by any of these parameters by clicking the corresponding column header.
On the left side of the window, there is a toolbar with four buttons that can be used to
The same options are available in the context menu (right click on a connection).
The Traffic pane displays a graphic representation of the amount of information being transferred.
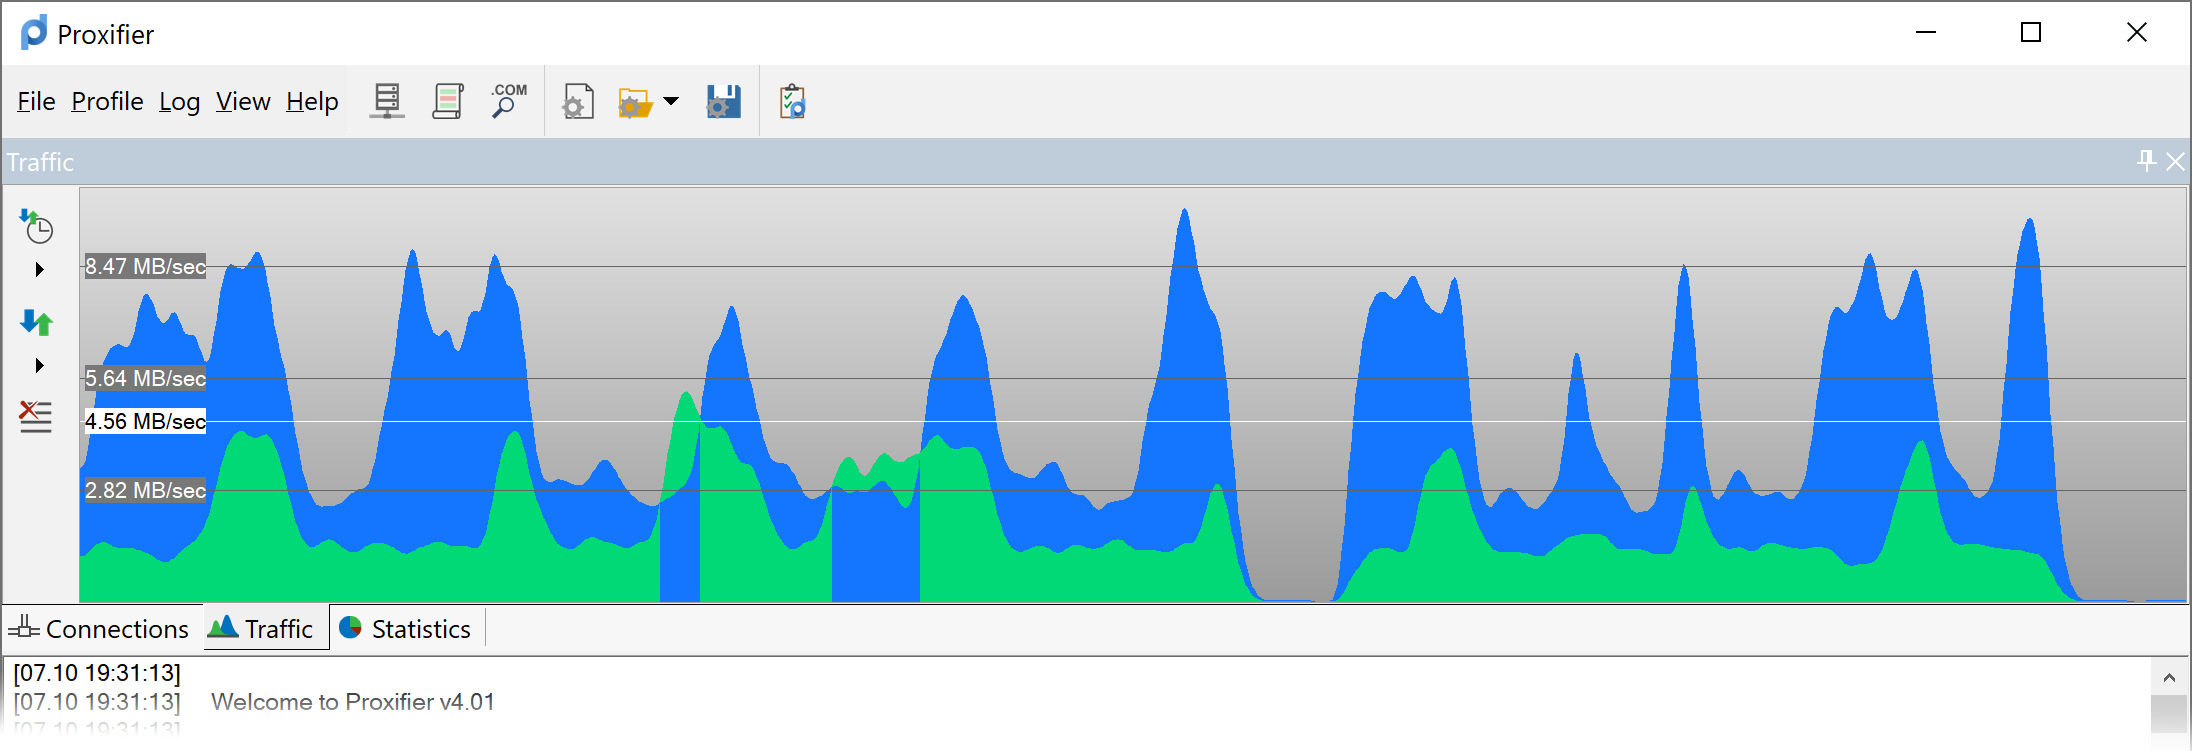
Blue represents incoming traffic and green outgoing traffic. The horizontal black lines indicate the data transfer rate. The white line indicates the average transfer rate for the displayed time period.
With the corresponding toolbar buttons or the context menu (right click), you can change the update rate, specify the type of graph, and clear it.
This pane shows various statistics on Proxifier’s work, including:
Using the corresponding toolbar buttons or the context menu (right click), you can copy the statistics to the clipboard or reset all the counters.
Proxifier outputs (logs) messages to this window in real time. Each entry may contain the following information:
You can change the extent of the output at the menu.
Four levels are available:
It is possible to write the output into a log file using the menu.
Proxifier can be hidden in the System Tray when the main window is closed ().
At the bottom of the main window there is a special information area called the that displays the DNS status, transfer rates, and number of active connections.